JWST Mapped WASP-17 b’s Atmospheric Edge—Without Taking a Direct Image
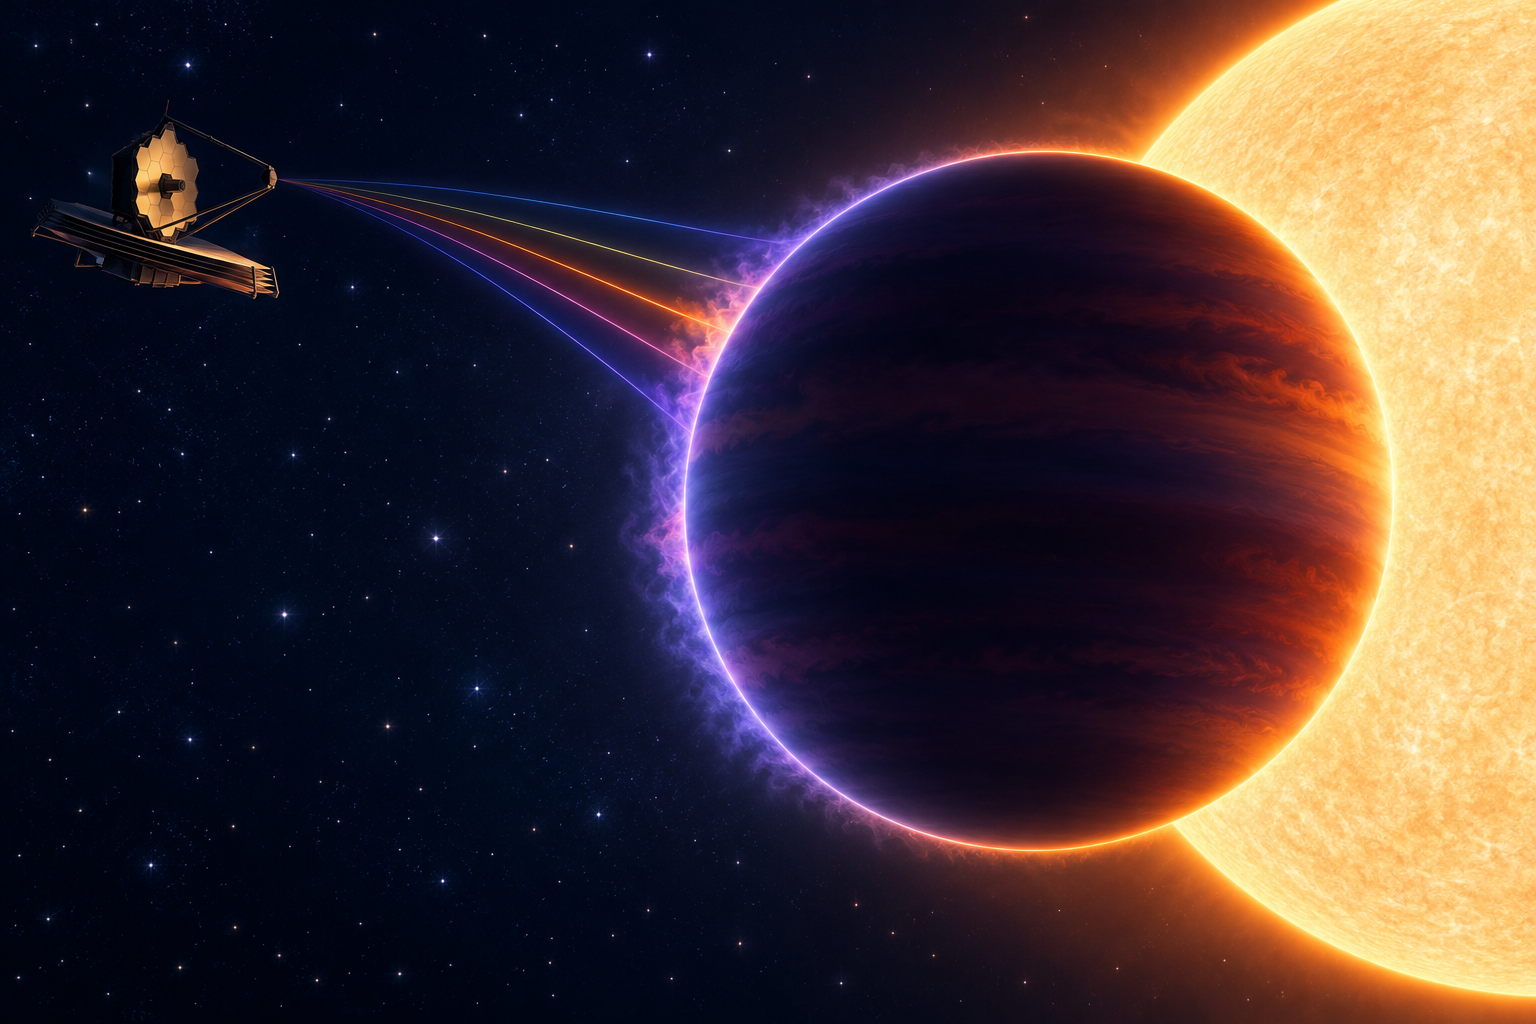
JWST has not taken a postcard-style picture of WASP-17 b. Instead, researchers used the planet’s transit—the moment it crosses its star—to map how its atmospheric edge changes from place to place. Their new analysis finds a dramatic difference between the two sides of that edge: about 858 K (585°C / 1,085°F) on the morning limb and 1,522 K (1,249°C / 2,280°F) on the evening limb. That is a roughly 650 K contrast, and it is a new way to ask a more detailed question about faraway worlds: not merely “what is in the air?” but “where around the planet is it different?”
The result, published October 14 in Nature Astronomy, is a win for patient measurement. WASP-17 b is roughly 1,300 light-years away, so there is no observing plan for a backyard telescope. But anyone can follow the discovery—and find other people who love unpacking the universe’s cleverest measurements—at Cosmic Match.
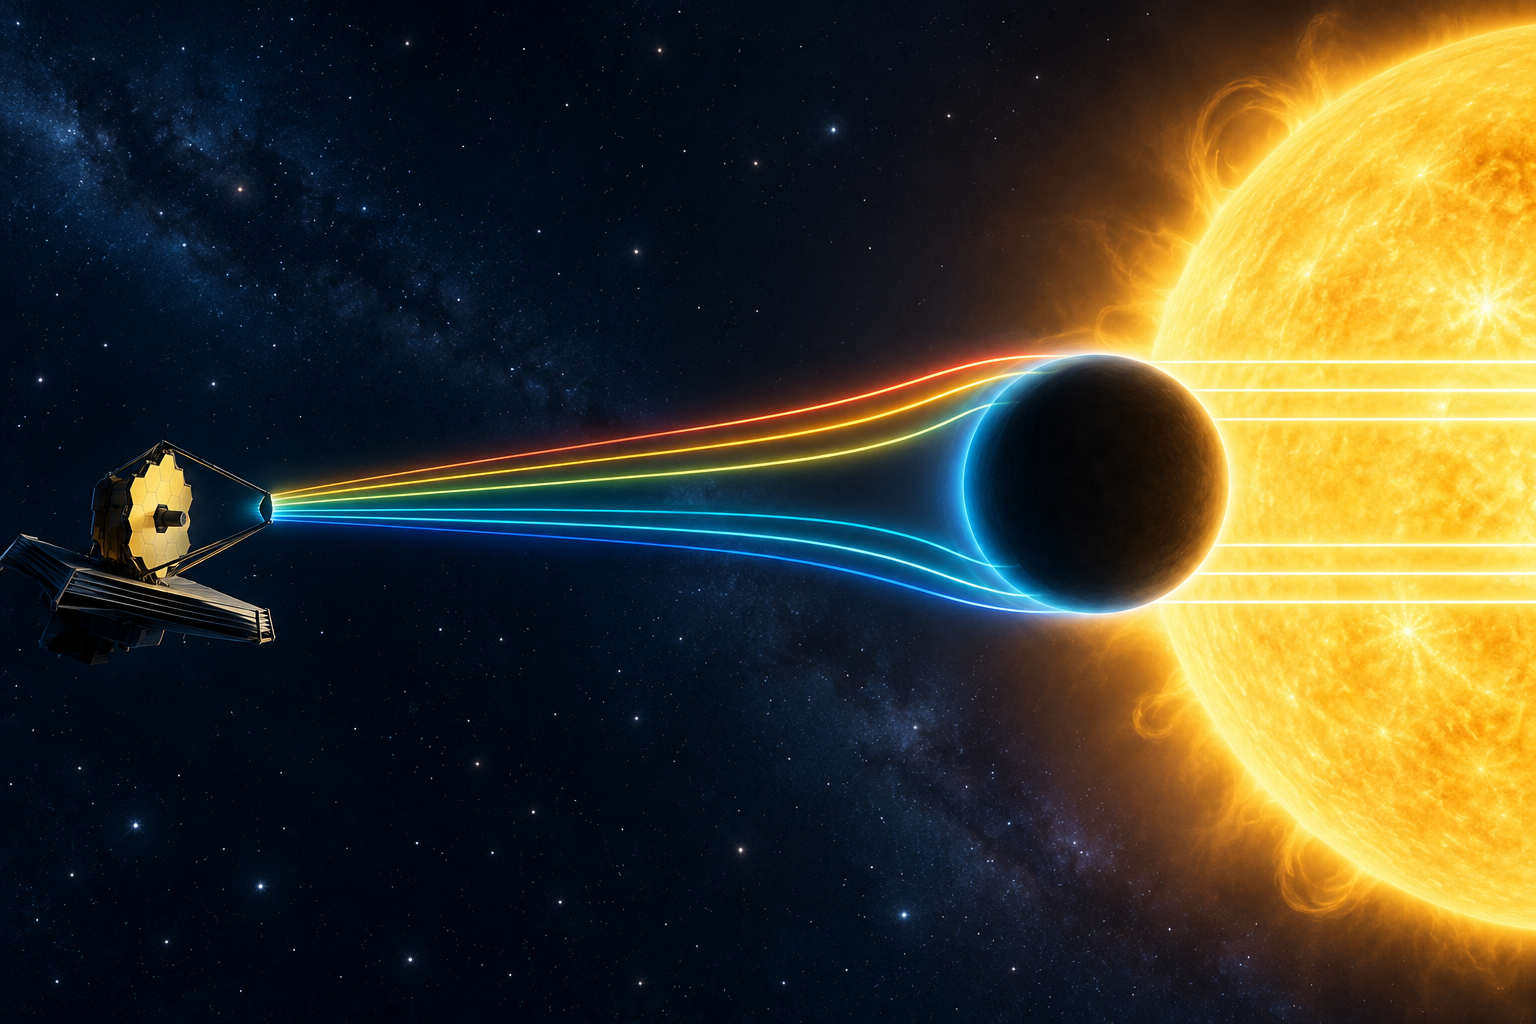
Illustration: transit spectroscopy measures filtered starlight; it is not a direct image of the planet.
What did JWST actually map around WASP-17 b?
The team mapped the planet’s limb: the thin ring of atmosphere seen around the planet’s silhouette during a transit. As starlight passes through that ring, gases absorb particular wavelengths. A standard transit spectrum averages that information around the whole rim. The new “transmission strings” method separates the contributions from different positions around it.
Think of the atmospheric edge as a circular string of tiny listening posts. Each position blocks and filters starlight a little differently as the planet moves in front of its star. Combining those time-resolved clues lets scientists reconstruct an uneven outline rather than assuming every part of the limb behaves alike.
That is why the mapped shape has prompted a “gemstone” analogy: the contour is not perfectly round. It does not mean JWST found a new gemstone or mineral. Separate earlier observations found evidence for quartz nanocrystals in WASP-17 b’s clouds; this paper is about the shape, temperature, and structure of the atmosphere.
How does transit mapping work without directly seeing the planet?
During transit, a planet blocks a small fraction of its star’s light. Its atmosphere blocks a little more at wavelengths that its gases absorb. JWST recorded this tiny wavelength-by-wavelength change from 0.6 to 12 micrometers using NIRISS/SOSS, NIRSpec/G395H, and MIRI/LRS observations.
The crucial move is timing. The leading and trailing edges of the planet meet the starlight at different moments. Rather than fold every moment into one average spectrum, transmission strings uses that changing geometry to estimate what the atmosphere is like around the rim.
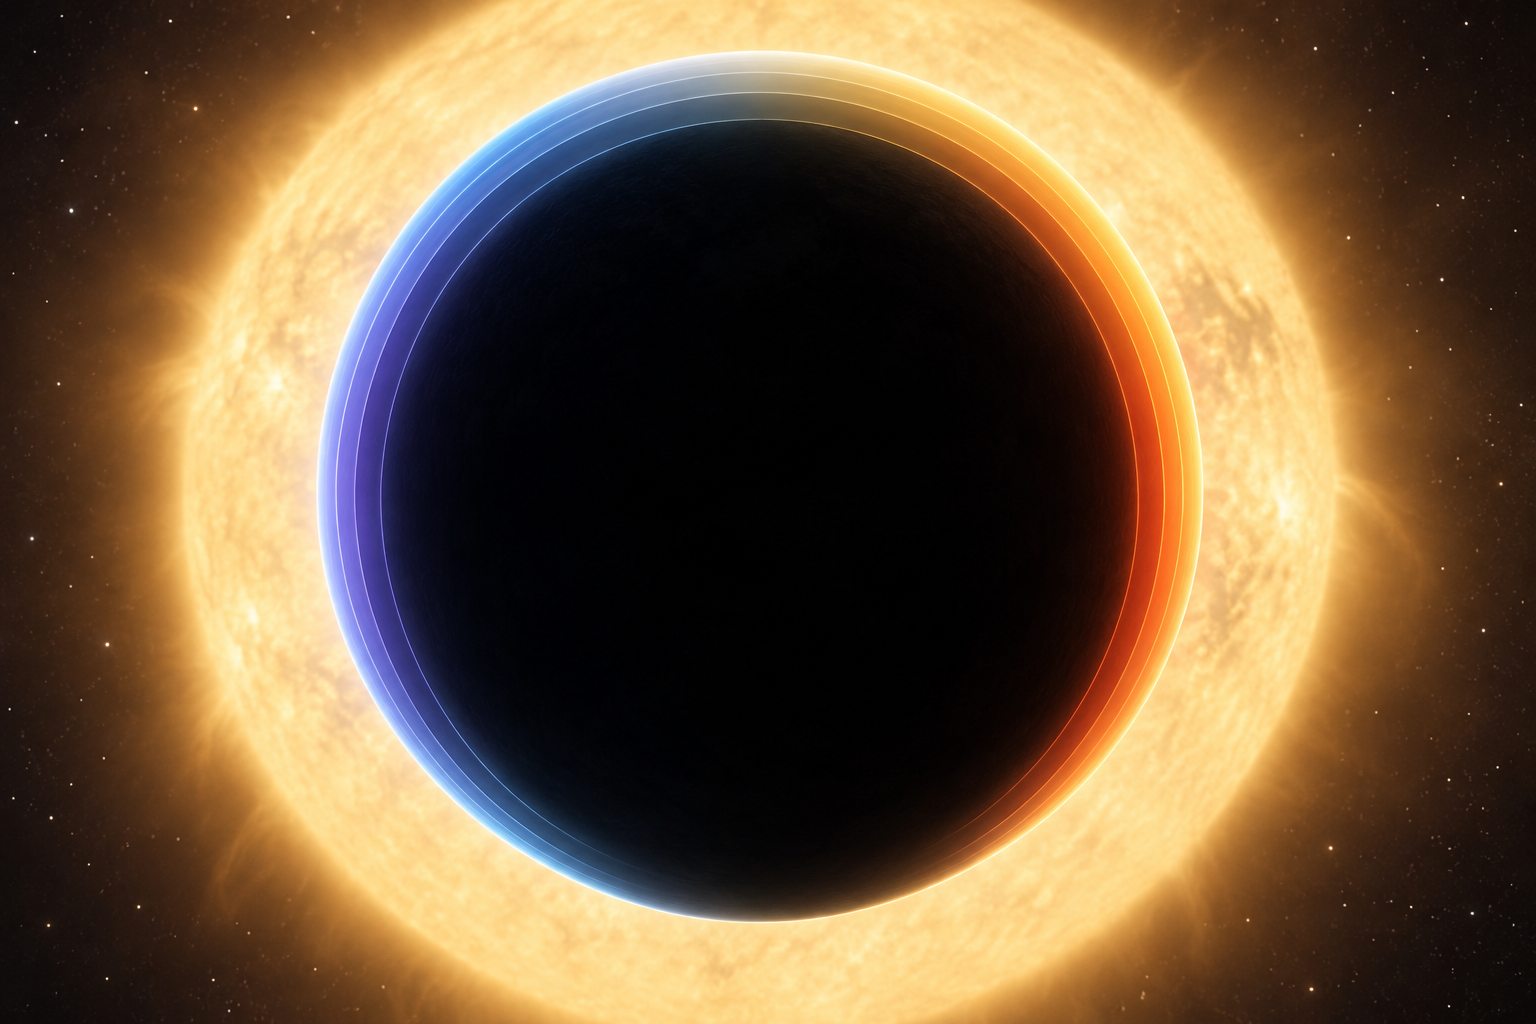
Illustration: the colors represent relative temperature and atmospheric-height variation around the limb, not a visible-light photograph.
This is different from direct imaging, where instruments work to separate faint planet light from the glare of a star. It is also different from eclipse mapping, which follows a hot planet as it disappears behind its star and can infer brightness patterns on the dayside. Transit mapping is about the atmosphere’s backlit edge.
What did the researchers find on the morning and evening limbs?
The atmosphere was not uniform. The study reports a cooler morning limb near 858 K and a much hotter evening limb near 1,522 K. The evening-side equator also appears more extended: hotter gas has a larger scale height, so it reaches higher above the planet at the pressures sampled in transit.
The chemical picture was notably steadier. Water vapor and carbon-dioxide abundances were consistent around the limb within the analysis, while the temperature and atmospheric scale height changed by position. That distinction matters: a planet can have broadly similar ingredients around its edge and still have very different local conditions.
WASP-17 b is an especially inflated “hot Jupiter,” orbiting its star every 3.7 days. NASA lists it at about 1.87 Jupiter radii but only 0.78 Jupiter masses—an unusually puffy world and a useful laboratory for this kind of atmospheric work.
Why is this a big deal for exoplanet science?
Exoplanet spectra are often described as if each planet has one global atmosphere. This result is a reminder that an averaged spectrum can smooth over real weather-scale differences. Mapping the limb begins to connect composition, circulation, and temperature structure instead of treating the edge as a single uniform band.
That is a method story as much as a planet story. Better spatial information could help astronomers test atmospheric models on worlds we cannot resolve into disks. It also gives curious beginners a great lens for reading space news: ask what was measured, what was inferred, and what remains out of reach.
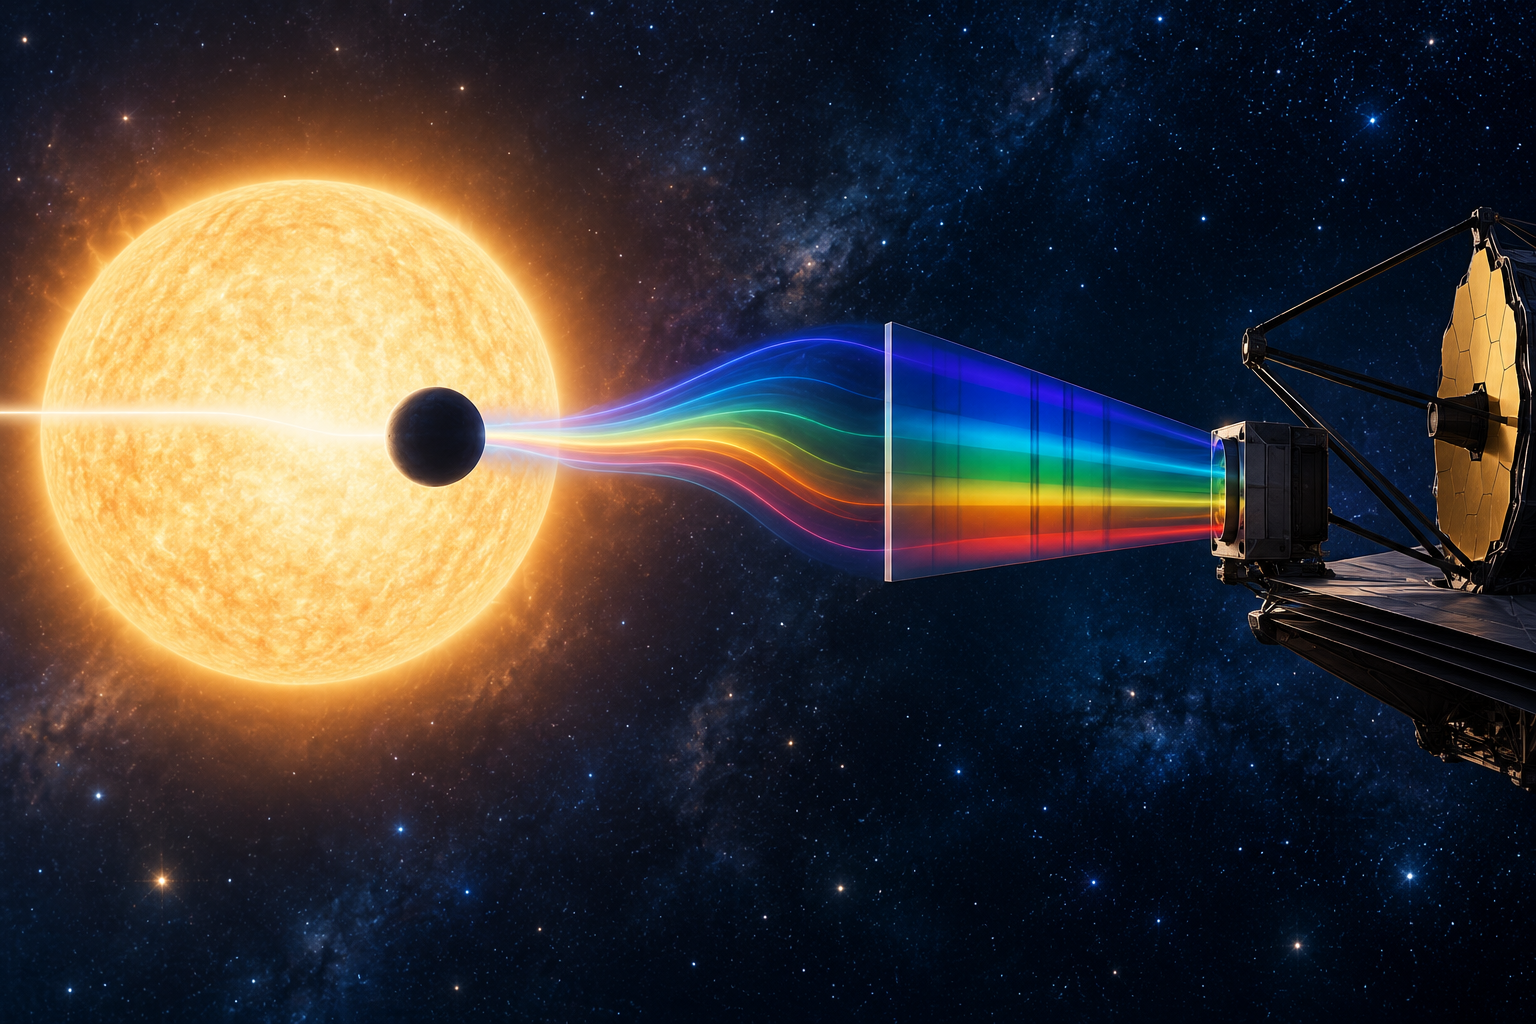
Illustration: astronomers infer atmospheric properties from subtle changes in starlight across wavelengths.
For more examples of how Webb and other observatories turn faint signals into new knowledge, read our guide to Hubble and Webb’s tiny worlds beyond Neptune and our look at Webb’s farthest localized fast radio burst. Then bring your most delightfully specific space question to a community that gets it: join Cosmic Match free.
The sources behind the map
The study is Mullally et al., “Transmission strings: mapping the three-dimensional terminator of WASP-17 b,” Nature Astronomy. Helpful plain-language context is available from Cornell, the University of Bristol, and NASA’s WASP-17 b catalog entry.
FAQ
Is this a direct image of WASP-17 b?
No. JWST measured changes in the host star’s light as the planet transited it. The map is a scientific inference about the atmospheric limb, not a resolved photograph.
What is an exoplanet’s limb?
It is the thin outer edge of the atmosphere seen in silhouette against the star during transit. Backlit gases there leave their fingerprints in the transmitted starlight.
Can I see WASP-17 b with a telescope?
Not as a visible world in a backyard telescope. The discovery is still wonderfully accessible: it shows how timing, light, and careful analysis let astronomers study an atmosphere around a planet roughly 1,300 light-years away.